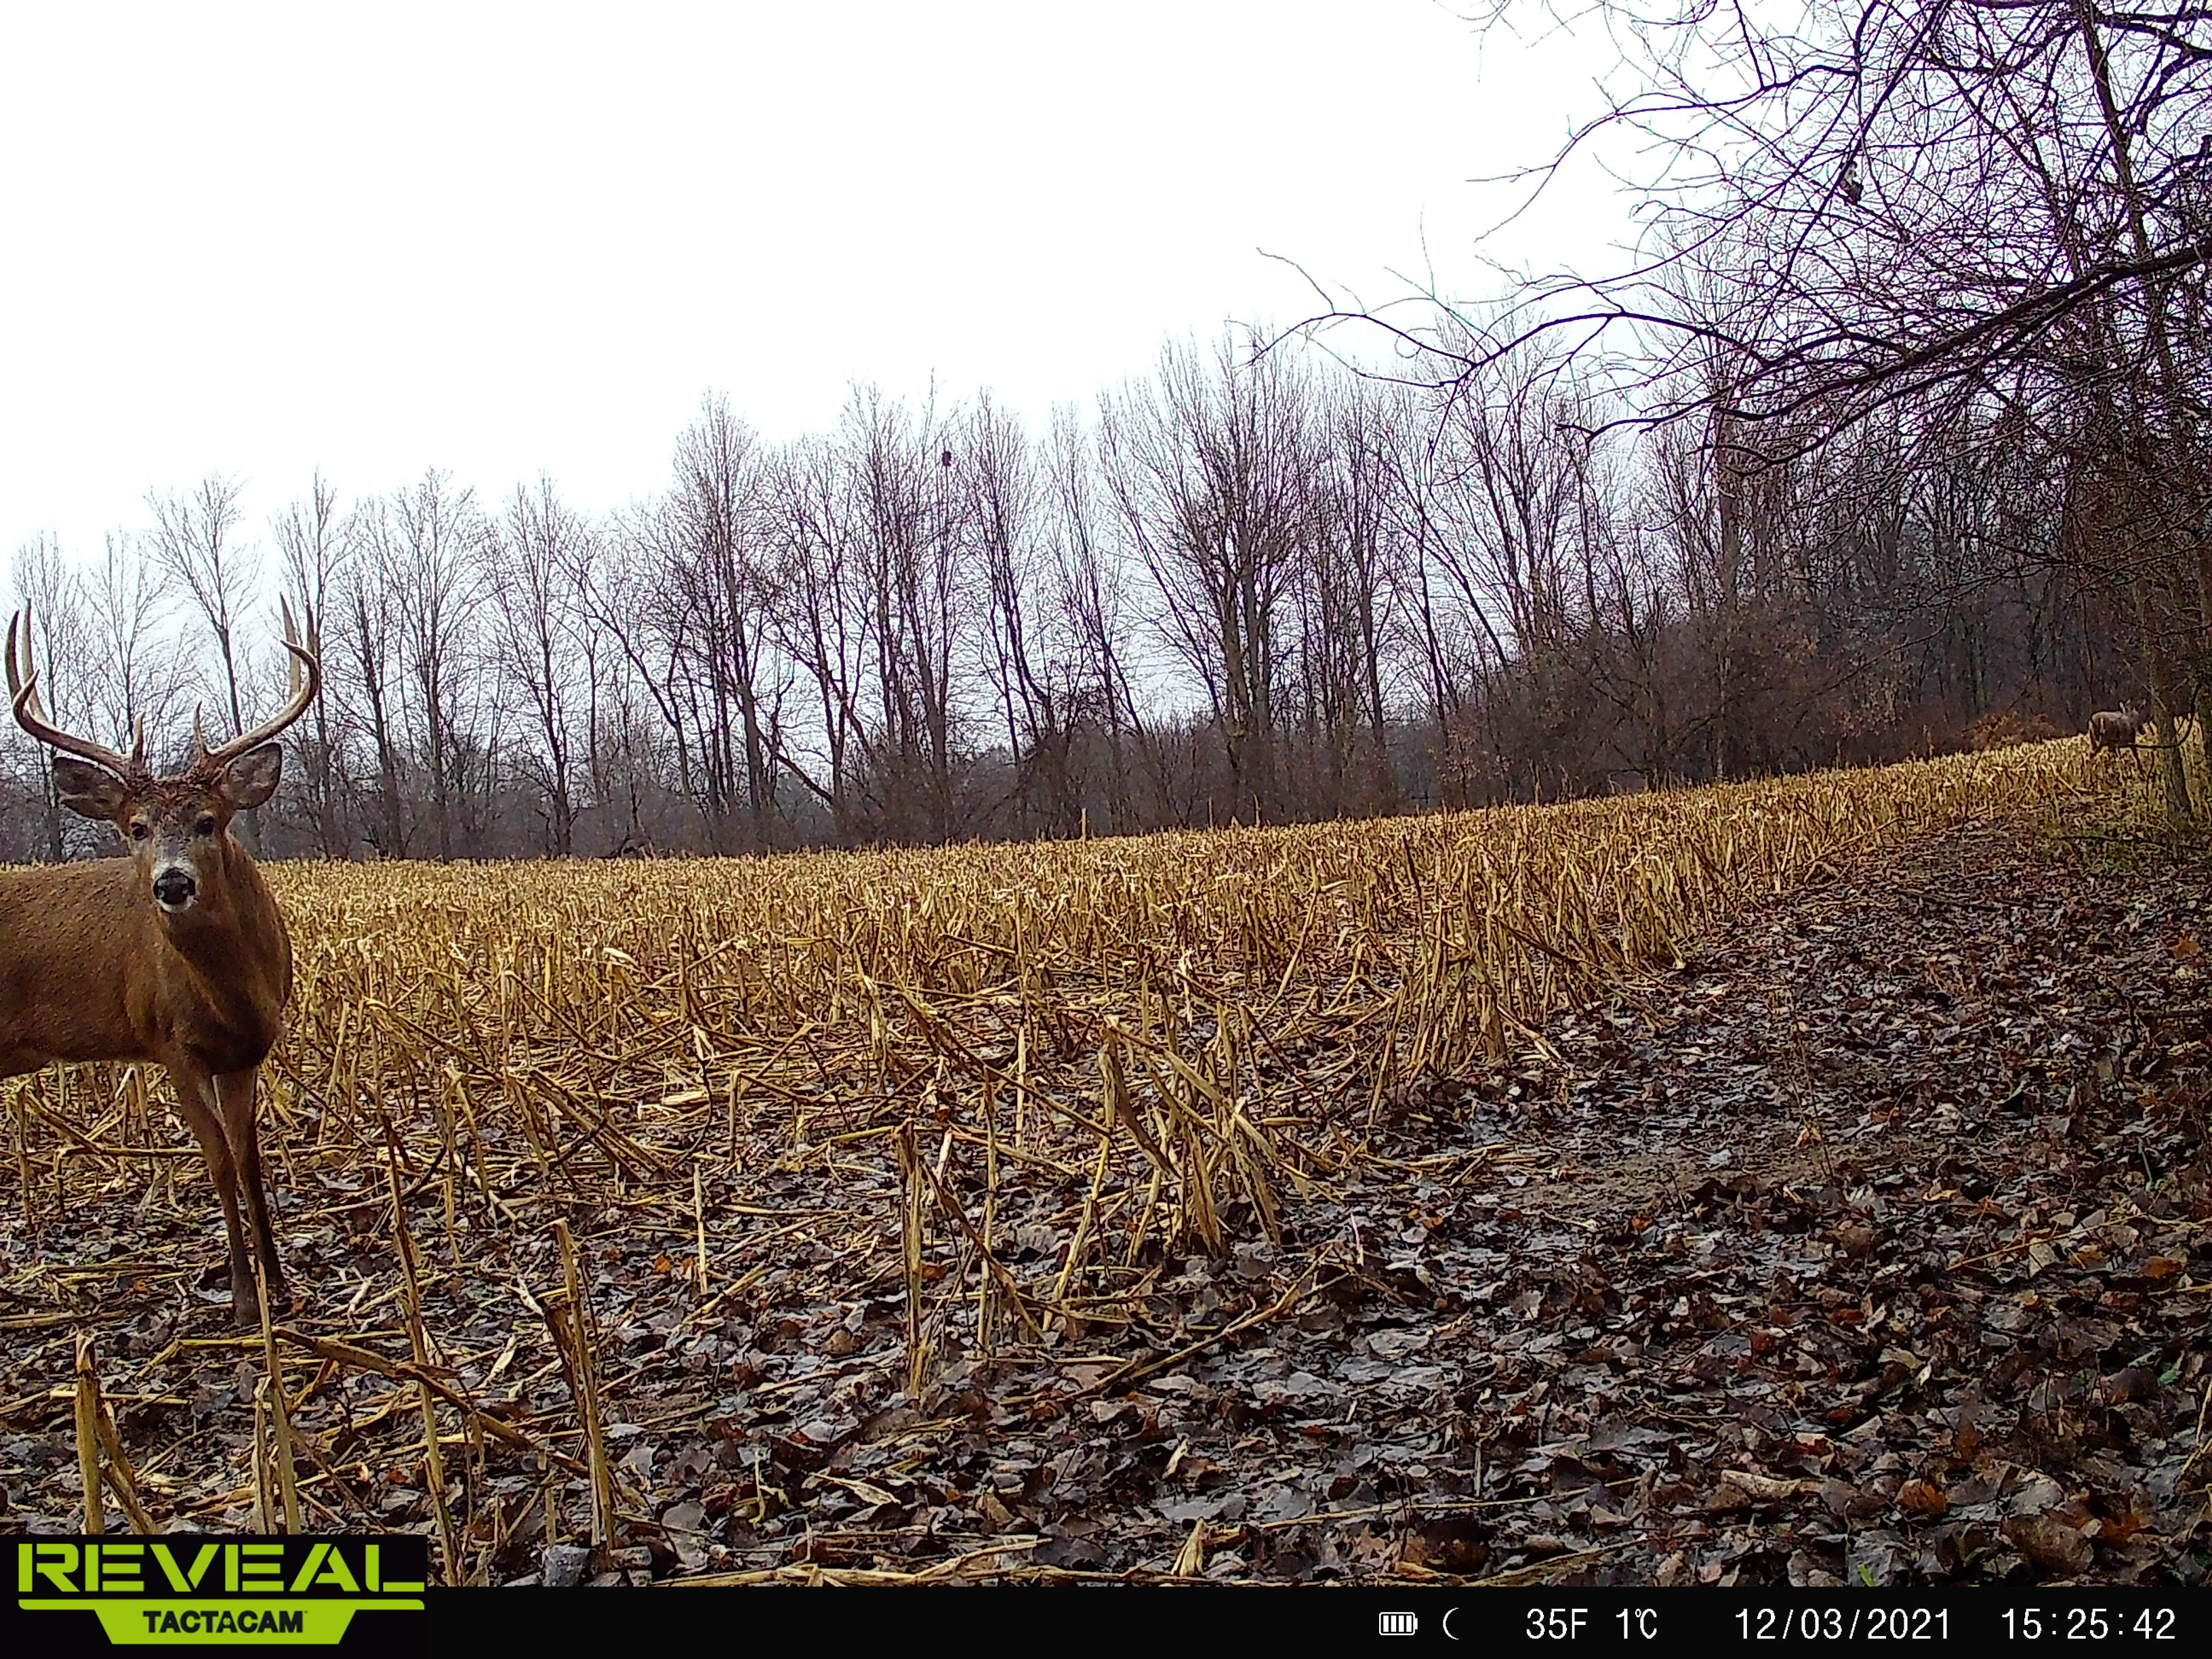
Mature bucks don’t do things by accident. Outside of a few bewildering moments during the rut, there’s almost always a reason for their movements, almost always a why. For this reason, the best deer hunters in the world make it a priority to ask and answer a whole lot of “Why Questions.”
Why did that mature buck show up on camera at Location A yesterday? Why did he daylight only three times last season? Why was he seen crossing that ditch four times in October but never once in November? Why does he visit the food plot all season but only on seemingly random days?
Answering questions like this can be daunting, but it’s also a big part of what makes hunting a mature buck so thrilling. It’s a giant game of cat and mouse, a chess match without equal. And the best tool I’ve found for winning that chess match, believe it or not, is a spreadsheet.
Why a Spreadsheet
One of the best ways I’ve found to help answer “Why Questions” is to keep careful records with a spreadsheet of every single data point related to what a target buck does (during huntable hours), where and when he does it, and the conditions present at those times. By recording this information accurately and carefully analyzing it you can identify patterns and correlations that will help predict a deer’s behavior ahead of time. And by doing this you increase your chances of positioning yourself in the right place at the right time to meet him.
Some might say this is overkill and insist that all that’s needed are the insights stored in their memory. But high-quality predictions require high-quality data. If all you ever feed into your internal prediction machine is what you anecdotally remember and a few recent photos you’re putting a whole lot of faith in the notoriously fickle and scientifically proven-to-be spotty human memory. On the other hand, specific data related to deer observations and photos, collected via a spreadsheet and paired with corresponding weather/date info, is the kind of input that can deliver true insights. Insights that lead to the kind of hunts that put mature bucks on the ground.
There are a number of ways you can record this kind of information—journals, mobile apps for trail cam photos, and mapping apps with notes all come to mind. But I’ve found a spreadsheet to be the very best tool for the job because it can be 100% customized to your needs and preferred variables, it can be easily filtered to show only relevant data for certain places or deer, and it can be used to create custom charts and graphs that help visualize trends.

Spreadsheet Specifics
The spreadsheet system I use to track deer activity is relatively straightforward and has proven to be endlessly useful to me over the last decade, but it’s far from the only way to skin this cat. For the sake of providing an example you might be able to build off of, I’ll share the system I use but feel free to customize this in whatever way works best for your hunting and scouting style. No matter what tool you use, format you choose, or variables you decide to track, the only true necessity is that you accurately record deer observations or photos and the corresponding conditions. It’s your choice how much detail, or lack thereof, you decide to include.
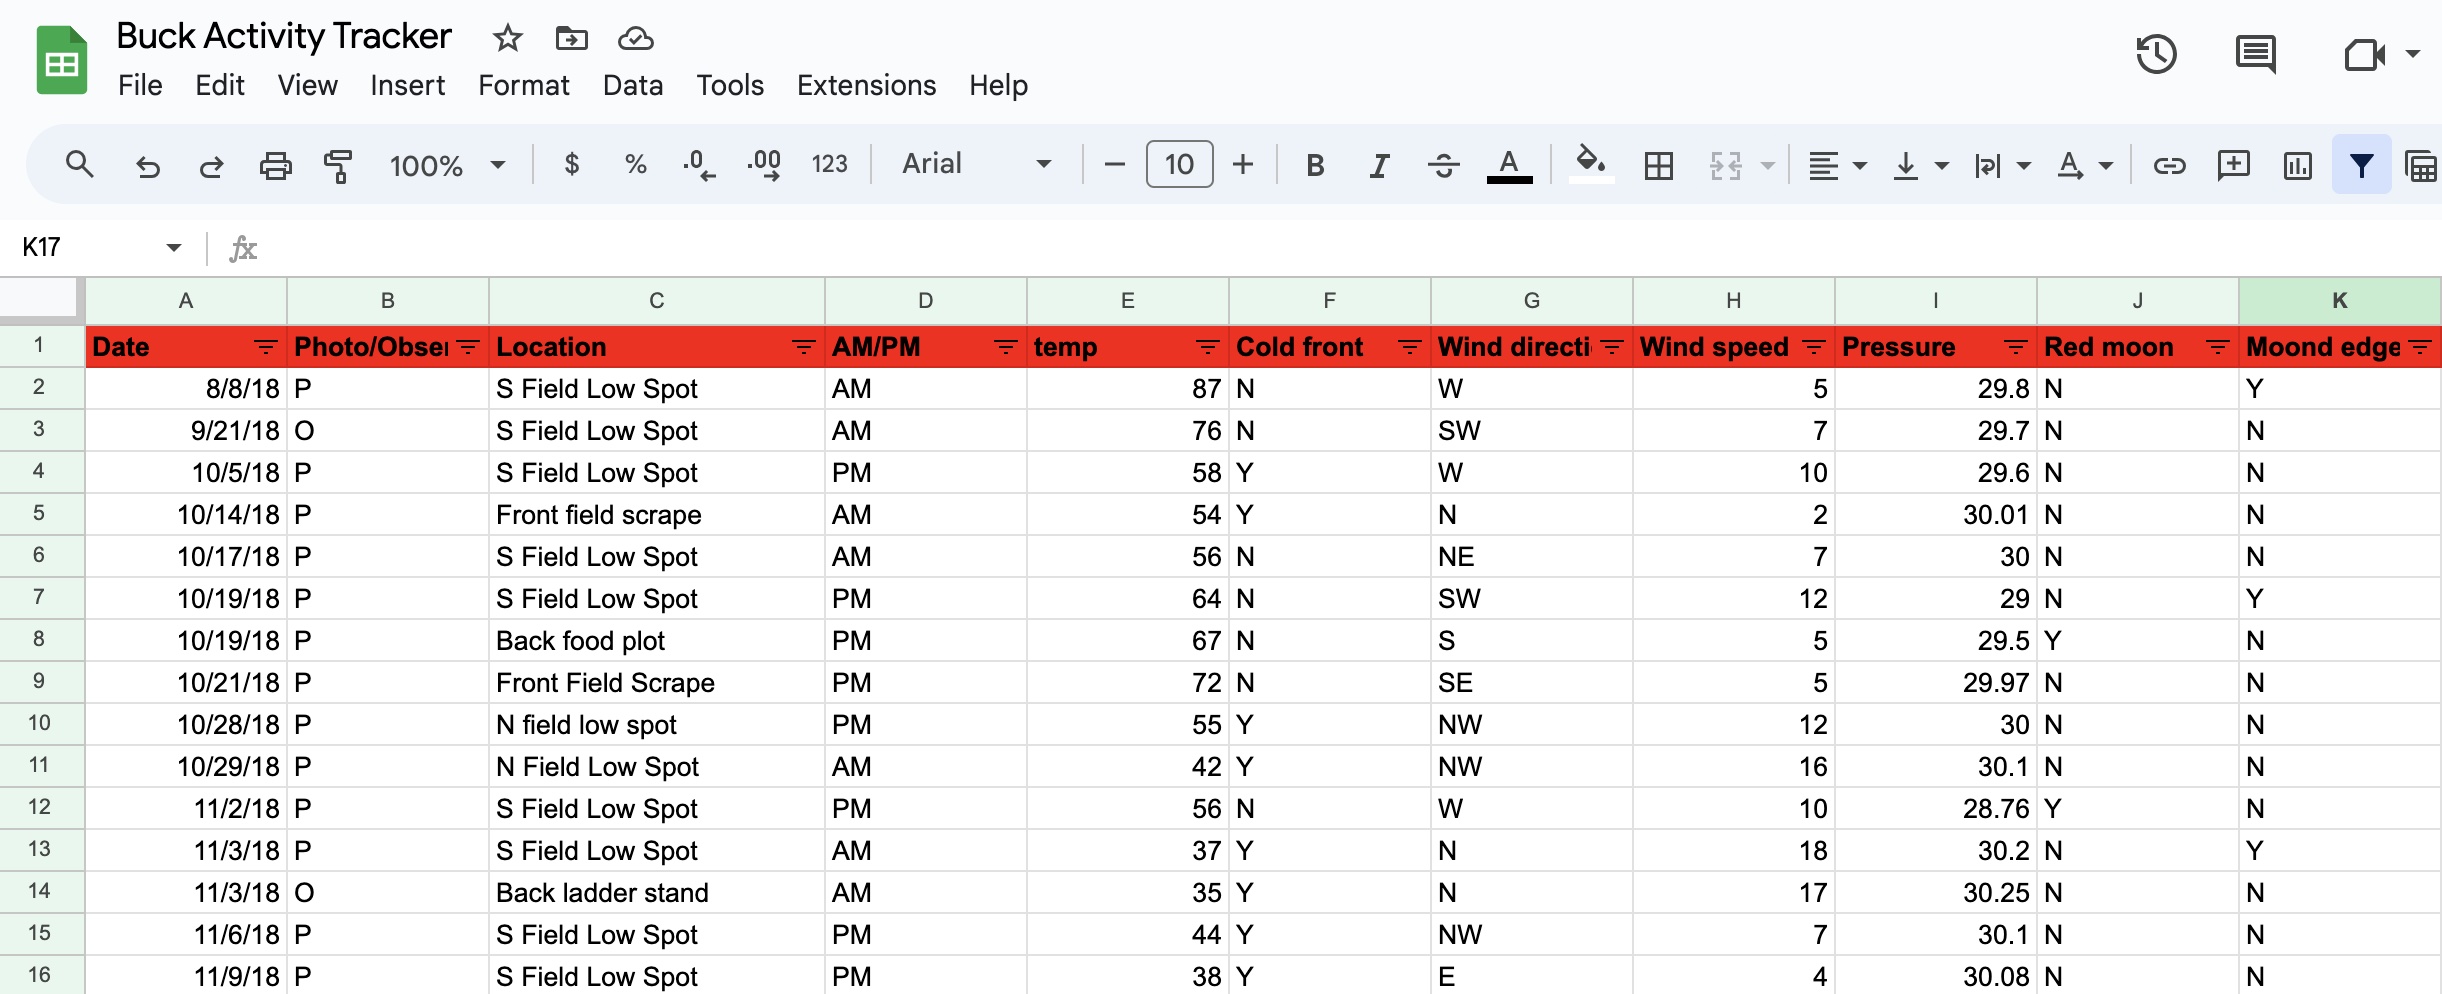
My spreadsheet tool of choice is Google Sheets, as it allows for record-taking and detailed analysis wherever and whenever necessary since the document is accessible via the cloud on my phone or laptop. The spreadsheet I’ve created for myself has thirteen columns across the top with a row added for each observation or photo. At this time I only include daylight photos in my sheet but there are some hunters who advocate for tracking even nighttime pics. That said, the categories of data I track for each daylight photo/observation, which are each a column on the spreadsheet, are listed below along with an explanation of what I’m tracking for each:
Date: This is the calendar date of the observation/photo, which is important for all the obvious reasons. I keep and return to these records for multiple years, as many mature bucks develop some level of annual pattern where they will do something similar at the same time every year. Keeping track of the exact date of every data point for years on end will help you identify any such trends.
Buck Name: I give a name to each buck 3.5 years or older that I include in my tracker so that I can filter the data to only show specific bucks that I’m targeting at a given time.
Photo or Observation: Because I keep track of both daylight photos and real-life observations, I denote in this column which is which with a simple “P” or “O.”
Location: Here I include a simple description of the location of the sighting or photo, with an emphasis on keeping my naming consistent across time so that I can filter for this specific location in the future.
AM or PM: I’ll note whether the data point was during morning hours or evening.
Temperature: I note the actual temperature at the moment of the photo/sighting.
Cold front: Given the emphasis many hunters put on cold fronts and the positive impact they have on deer movement, I also look at the temperatures the day or two before the photo/sighting. If there was a 10-degree temperature drop within a day or two of the data point, I will mark this column as “Y” for yes.
Wind Direction: I simply note the wind direction at the given time.
Wind Speed: Same for wind speed.
Barometric pressure: Here I track the barometric pressure, noting that higher values or a rising barometer are often believed to trigger increased movement.
Red moon: “Red moon” days are tracked by many serious deer hunters who have noticed an uptick in deer activity on days when the moon is positioned directly overhead or underfoot at key deer movement times. These days can be seen on the Deer Hunter’s Moon Guide or any free moon position table. While I’m not fully convinced of this theory myself, I track it nonetheless to see if any correlation ever appears between the moon and daylight activity. If a photo or observation occurs during one of these days, I’ll mark this column as “Y” for yes.
Moon on the Edges: Another moon theory posits that deer activity increases on days when the moon is rising or falling during the typical morning or evening hours of deer activity. If that occurs on the day of the sighting/photo, I mark this as a “Y.”
Notes: Here I’ll add any relevant information about the photo or observation. This might include notes about the travel route a deer took, where he came from, or how he interacted with other deer.
I’ll update this spreadsheet as often as I can throughout the season for every daylight photo or observation I have of a target buck. If at any point I fall behind or if I’m filling in a backlog on a buck I didn’t track the previous year, I get the necessary historical weather data from the Weather Underground website. I pull all of this data manually and fill out my sheet myself, but there are some spreadsheet whiz kids who are able to automate this process. If you’ve got the know-how I’d encourage you to give it a try, but a little keyboard punching will be necessary for the rest of us mortals.

Putting It Into Action
Once your spreadsheet is up to date, it’s time to begin the analysis. There are a number of different ways to do this depending on goals, but let’s assume we’re after a specific buck and trying to figure out when and where to get a crack at him. In this case, I’d begin by filtering my spreadsheet to show just the data related to that deer.
If I have multiple years of history with this deer I’ll begin by looking for annual patterns. Did the first daylight photo or observation happen around the same time during multiple years? Were there any chunks of time where there were multiple daylight photos/observations in a short period around the same calendar date? What were the top time periods for activity in those past years?
While there are no guarantees, any pattern you can recognize from past years is worth considering as a possible repeat this coming season. It’s uncanny how often these repeat performances occur. For example, I hunted a buck last year that two years in a row disappeared in November and returned/daylighted for several days in early December. This past year, when early December arrived and I got the right conditions, I headed out to hunt him in the same area he’d returned to in the past. Sure enough, he did it again and I killed him exactly one year to the date and almost in the exact spot, I got his photo 365 days earlier. Previous year data can also help illuminate how a buck reacts to certain conditions.
With that in mind, with both the previous year's or the present year's data, it’s worth looking closely for any consistent increase in movement related to weather/moon-related factors, preferred locations, and time of day or wind-specific correlations. Essentially we’re looking for any data that suggests a buck is more likely to move during daylight when a certain condition is present. Is there any outside factor (those being the data categories listed in your spreadsheet) that disproportionately correlates with the daylight appearances of the buck you’re after? Are the majority of daylight appearances happening on cold fronts? Red moon days? Only happening in November? Usually happening with a southerly wind?
I’m no spreadsheet expert. But even at my amateur level, I’m able to derive valuable insights like these that would otherwise be invisible to me. Patterns are sometimes noticeable just by looking at the data itself, but they become even more apparent when you create charts or graphs with the data. Whether you use Microsoft Excel or Google Sheets, take a little time to learn how to use the graph/chart feature so that you can create pie charts, line graphs, or bar graphs from the data sets you’ve compiled. You could, hypothetically, look at a pie chart showing every daylight observation of your target buck broken down by wind direction or moon phase. Or how about a line graph that shows the trend of daylight activity from your target buck by date, so you can see how his activity ebbs and flows based on the calendar? Or maybe a bar graph breaking down daylight activity on cold front days versus warmer weather?
Kill Them With Data
I recognize that none of this is sexy and it’s not your standard issue woodsmanship that we all love to romanticize, but data is as effective a hunting tool as any other you might see at a store or mentioned in a podcast. If you’re willing to put in the keyboard time, carefully compiled observations and camera photos analyzed with the help of a spreadsheet are without a doubt a pathway to better hunting predictions and better hunts.
Sure, you’re hunting buddies might laugh and call you a nerd, but I promise they’ll be jealous as hell of the buck in the back of your truck.


